
Introduction
Most DTC brand owners know their paid ad numbers cold. ROAS, CPC, CTR — they can recite them from memory. But ask what their email flows generated last month, what their repeat purchase rate looks like by segment, or how SMS is contributing to total store revenue, and you get a blank stare.
That's the real problem. There's more data than ever — the gap is reporting that actually connects it to business decisions.
This guide covers what digital marketing reporting is, what to include in a report, which KPIs matter by channel, how to build a reporting process that actually works, and the most common mistakes brands make.
Key Takeaways
- A report that only lists numbers is a data dump — good reporting drives decisions
- KPIs should match your goals, not your platform's default metrics
- Email and SMS need their own reporting lane, not a footnote in a general marketing summary
- Every good report answers: what happened, why it happened, and what to do next
- Always compare against prior periods, same period last year, or stated targets — raw numbers alone tell you nothing
What Is Digital Marketing Reporting (and Why It Matters for DTC Brands)
Digital marketing reporting is the ongoing process of collecting, organizing, and analyzing data from your marketing channels to evaluate performance, understand what's driving results, and make smarter decisions about budget, strategy, and creative.
In practice, most brands confuse reporting with dashboards — and the distinction matters.
Dashboards vs. Reports
| Dashboard | Report | |
|---|---|---|
| Shows | What's happening right now | What happened and why |
| Audience | Channel managers, daily users | Executives, strategic decisions |
| Output | Live metrics | Analysis + recommendations |
| Cadence | Ongoing, real-time | Weekly, monthly, quarterly |
A dashboard is a monitoring tool. A report is a decision-making tool. Both are useful — but they serve different people at different moments.
Why This Matters More for DTC Than B2B
B2B companies measure pipeline. DTC brands have to track revenue contribution from every channel — paid, organic, email, SMS — against concrete metrics like AOV, LTV, and CAC. There's no pipeline buffer to absorb bad spend decisions.
That gap has a cost. A 2024 Gartner survey of 378 senior marketing leaders found only 52% successfully proved marketing's value and received credit for its contribution to business outcomes. For DTC brands, that inability to connect spend to revenue means:
- Budgets get cut from channels that were actually working
- Profitable segments go unidentified while underperformers keep running
- Retention channels like email and SMS get deprioritized for flashier acquisition spend
What to Include in a Digital Marketing Report
Every good marketing report must answer three questions:
- What happened? Results by channel and campaign
- Why did it happen? The story behind the numbers
- What should we do next? Specific, actionable recommendations
Reports that stop at the first question are data dumps — they describe the past without influencing the future.
Essential Report Structure
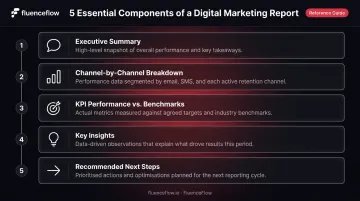
A complete digital marketing report includes:
- Executive summary: Revenue impact and overall performance in plain language
- Channel-by-channel breakdown: Email, SMS, paid, and organic results reported separately
- KPI performance vs. benchmarks: Numbers without comparison points tell you nothing
- Key insights: What's worth paying attention to — and what to ignore
- Recommended next steps: Specific actions that follow directly from the data
The Benchmarking Problem
A 3% email click rate means nothing on its own. Use three comparison types:
- Prior period (MoM or WoW) — shows short-term trajectory
- Same period last year — accounts for seasonality, which matters enormously for DTC brands during BFCM, Q4, and product-specific peaks
- Stated targets — tracks progress against goals set at the start of the period
Format the Report for Its Reader
A Shopify brand founder needs a one-page view of revenue impact and ROI. A channel manager needs granular breakdowns with optimization recommendations. The same report doesn't serve both.
Choose the delivery format accordingly — PDF, live dashboard, email summary, or slide deck — based on how the reader actually consumes information.
One underused element: include a brief metric dictionary. Define how key terms like "conversion," "ROAS," or "revenue attributed to email" are calculated in your specific setup. Klaviyo and Google Analytics, for example, often report different revenue numbers for the same campaign — because they use different attribution windows. A quick definition prevents that confusion before it starts.
The Key KPIs to Track Across Your Marketing Channels
Start with the north star metrics every DTC brand should anchor its reporting around:
- Total revenue — the baseline everything else ladders up to
- Conversion rate — by source and channel
- Customer acquisition cost (CAC) — total acquisition spend divided by new customers acquired
- Return on ad spend (ROAS) — revenue attributable to ads divided by ad cost
- Customer lifetime value (LTV) — average purchase value × purchase frequency × customer lifespan
Everything else in your report should connect back to these.
Paid Advertising KPIs
For PPC and social ads, track:
- Impressions, CTR, CPC, CPA, and ROAS by campaign
- Marketing Efficiency Ratio (MER) — total revenue divided by total ad spend, also called blended ROAS
ROAS at the campaign level is useful. But for DTC brands running multiple paid channels simultaneously, MER gives a more accurate picture of overall paid performance. A campaign can show strong ROAS while MER deteriorates — a warning sign that gets missed without the blended view.
Email and SMS Marketing KPIs
This is where most DTC reporting falls short. Email and SMS aren't supporting characters — for many brands, they're the primary retention engine.
Core email metrics to track:
- Open rate, click rate, and conversion rate
- Revenue per recipient (RPR) — this is where the gap between campaigns and flows becomes visible
- Unsubscribe rate (as a list health signal)
- Flow revenue vs. campaign revenue — tracked separately, not blended
The RPR gap between campaigns and automated flows is stark. Klaviyo's 2024 benchmark data shows campaign RPR at $0.11 versus $3.65 for abandoned cart flows — a 33x difference. Blending these two numbers hides which part of your program is actually working.
That unit economics lens shapes how the best-performing brands structure their email reporting. Rather than leading with open rates, strong reports track attributed revenue, email's share of total store revenue, and flow revenue versus campaign revenue. It's a framework FluenceFlow uses across their client portfolio — where email and SMS average 41% of total store revenue, measured using Klaviyo's native attribution.
2024 SMS benchmarks (Postscript):
| Metric | Campaign Median | Automation Median |
|---|---|---|
| CTR | 4.0% | 10.0% |
| Conversion rate | 0.5% | 1.5% |
| Earnings per message | $0.20 | $0.50 |
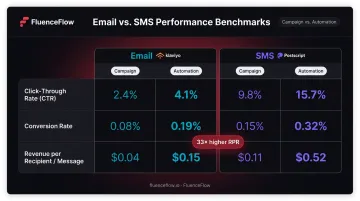
Same pattern as email: automations dramatically outperform broadcasts on a per-message basis.
SEO and Organic KPIs
Key metrics to monitor:
- Organic sessions and organic conversion rate
- Keyword rankings — especially non-branded terms
- Top landing pages by traffic and revenue contribution
These are longer-cycle metrics. Week-over-week comparisons are noise — year-over-year is the meaningful comparison for organic.
How to Build a Digital Marketing Report Step by Step
Step 1: Define Who the Report Is For
Before pulling a single metric, answer two questions: Who is reading this, and what decision does it need to support?
A weekly report for a brand operator should guide a specific decision — should we scale this campaign? should we pause this flow? — not just show data. The audience shapes every subsequent choice.
Step 2: Choose KPIs Based on Goals, Not Volume
Resist the urge to include every available metric. Use a KPI tree:
- North star outcomes (revenue, profit)
- Marketing-level KPIs (ROAS, email revenue share)
- Channel and campaign-level metrics
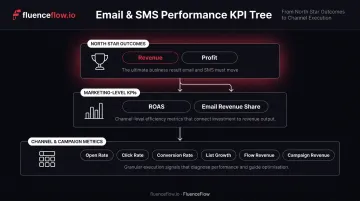
Cap it at 3-5 key metrics per channel or goal area. A report with 40 metrics signals a lack of strategic clarity — it doesn't signal rigor.
Step 3: Consolidate Data From All Platforms
Marketing data lives in GA4, ad platforms, Klaviyo, SMS tools, and your CRM — and each platform counts things differently, with varying attribution windows, time zone settings, and conversion definitions.
Before reporting begins, standardize:
- Campaign naming conventions across all platforms
- Attribution window settings (especially in Klaviyo)
- How "revenue" is defined in each tool
Step 4: Visualize Data to Make Trends Visible
Match chart types to the story:
- Line charts for trends over time
- Bar charts for channel comparisons
- Funnel views to show drop-off
Keep each page or section to one main point. Cramming three insights into one visual means none of them land.
Step 5: Translate Data Into Insights and Next Steps
Visualization gets data in front of people — interpretation tells them what to do with it. Instead of writing "email revenue dropped 18% this week," write:
"Email revenue dropped 18% this week because the post-purchase flow paused due to a list segment issue — we estimate $X in missed revenue — we're restoring it and adding a monitoring alert to prevent recurrence."
One paragraph. One clear sequence: what happened, why it happened, what it cost, and what's being done. That's a report someone acts on.
Types of Digital Marketing Reports (by Channel and Cadence)
Report Types by Channel
- PPC/paid media — spend, ROAS, CPA, CTR by campaign
- SEO — rankings, organic traffic, organic conversions
- Email and SMS — flows vs. campaigns, RPR, revenue by sequence
- Social media — engagement, reach, traffic, conversions
- Cross-channel overview — total revenue attribution across all channels
One channel that consistently gets buried: email and SMS. DTC brands running retention programs should give it a dedicated reporting lane — lumping it into a general marketing summary is how brands underestimate what retention is actually generating.
Reporting Cadence
| Frequency | Best For |
|---|---|
| Daily | Active paid campaigns — catching cost spikes early |
| Weekly | Campaign performance tracking and optimization |
| Monthly | Trend analysis and stakeholder communication |
| Quarterly | Strategic budget decisions and planning |
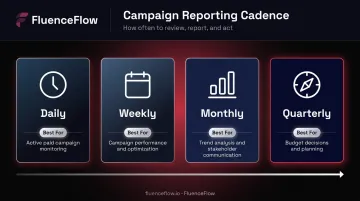
Meeting cadence matters. Gartner found that 62% of marketing leaders who met regularly with analytics teams successfully proved marketing's value — compared to only 30% among those who didn't. Regular review rhythms keep you close enough to the data to catch problems before they compound — not just audit them after the fact.
Common Digital Marketing Reporting Mistakes to Avoid
Mistake 1: Reporting Vanity Metrics Instead of Outcome Metrics
The most common vanity metrics DTC brands over-index on:
- Total email list size (without engagement or revenue segmentation)
- Social likes and follower counts
- Raw open rates without conversion context
- Impressions without click or revenue data
None of these connect directly to revenue. Replace them with attributed revenue, repeat purchase rate, and conversion rate by source.
Mistake 2: Using Too Many KPIs
More metrics do not equal more insight. A report packed with 40 data points signals that no one has made hard choices about what actually matters. Metric overload makes it harder — not easier — for stakeholders to act.
Stick to the 3-5 KPIs per goal or channel rule. If a metric doesn't inform a specific decision, it doesn't belong in the report.
Mistake 3: Skipping the "So What"
Sending an automated dashboard link without narrative context is data delivery, not reporting.
The analysis and recommendation layer is where reporting creates business value. Every report should tell a reader what happened, what it means, and what changes as a result. Without that layer, even accurate data produces no action.
All three mistakes share the same root problem: optimizing for output over insight. Fix the metrics, trim the KPIs, and add the narrative layer — and your reports will start driving decisions instead of just filling inboxes.
Frequently Asked Questions
What are digital reporting tools?
Digital reporting tools are software platforms used to collect, consolidate, and visualize marketing data from multiple channels. Common categories include web analytics (GA4), email and SMS platforms (Klaviyo), ad platform dashboards, and BI/visualization tools like Looker Studio and Power BI.
How do you make a digital marketing report?
Define the audience and the decision the report needs to support. Then select relevant KPIs, pull data from all active channels, visualize key trends, and write insights with clear next steps — not just numbers.
What should a digital marketing report include?
Four components: a summary of marketing activity, performance data by channel and KPI, an explanation of what the results mean, and recommended next steps. Reports missing any of these four are incomplete.
How often should you send a digital marketing report?
Cadence depends on the channel and audience. Daily for active paid campaigns, weekly for campaign tracking, monthly for trend analysis and stakeholder communication, and quarterly for strategic budget planning and review.
What is the difference between a marketing report and a marketing dashboard?
Dashboards show real-time or near-real-time data for day-to-day monitoring. Reports are structured summaries that include context, analysis, and recommendations. Dashboards show what is happening — reports explain what happened and what to do next.
What are the most important KPIs for e-commerce marketing reports?
For DTC brands: CAC, LTV, ROAS or MER, conversion rate, AOV, email and SMS revenue contribution, and repeat purchase rate. The right mix shifts depending on whether you're optimizing for acquisition, retention, or profitability.