A 2024 Gartner survey found that only 52% of senior marketing leaders can prove marketing's value and receive credit for business outcomes — and that's among experienced marketers with dedicated analytics resources. For DTC founders managing multiple channels simultaneously, the gap is often wider.
This guide walks through a practical measurement framework built for DTC brands: how to set goals before launch, which metrics actually connect to revenue, and how to analyze your email and SMS performance with precision.
Key Takeaways
- Define success criteria — goals, KPIs, time frame — before you launch, not after
- Separate vanity metrics (impressions, likes) from revenue metrics (CAC, ROAS, CLV)
- Email and SMS are the most measurable and highest-ROI channels when properly tracked
- Analyzing campaign data means comparing against baselines, segmenting by audience, and accounting for time lags
- Use measurement to drive real-time optimization and shape future strategy — not just confirm what already happened
Before You Measure Anything: Set Clear Campaign Goals
Most campaigns fail at measurement before they launch. If success was never defined upfront, any result can look like a win or a loss depending on your mood that week.
Shopify's SMART framework — Specific, Measurable, Attainable, Relevant, and Time-bound — gives you a solid foundation. A SMART goal isn't "grow email revenue." It's "increase email-attributed revenue from 18% to 25% of total store revenue by end of Q3."
Before any campaign goes live, answer three questions:
- What specific business outcome do we want? More new customers, higher repeat purchase rate, increased average order value — pick one primary outcome
- How will we directly measure it? Name the metric and how it's tracked
- What's the minimum return that justifies the spend? This sets your floor, not your ceiling
Strategic Goals vs. Tactical Goals
These two layers serve different purposes, and confusing them is where most brands lose focus.
Strategic goals measure ultimate success — revenue generated, new customers acquired, retention rate improved. These determine whether the campaign was worth running at all.
Tactical goals are your early warning system: click-through rate, email open rate, add-to-cart events. They help you course-correct mid-campaign before you've burned the full budget.
Both matter. Only one should be your primary KPI.
Aligning Goals to the Marketing Funnel
Campaign goals — and the metrics you use to evaluate them — shift depending on where in the funnel you're operating.
| Funnel Stage | Primary Goal | Metrics That Matter |
|---|---|---|
| Awareness | Reach and visibility | Impressions, reach, new audience growth |
| Consideration | Engagement and intent | CTR, time on site, add-to-cart rate |
| Conversion | Purchase and revenue | Purchase rate, ROAS, CAC |
| Retention | Repeat behavior | Repeat purchase rate, CLV, email/SMS revenue |
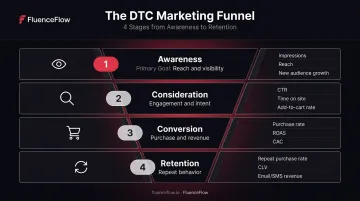
Conflating these stages leads to misleading results. An awareness campaign measured by purchase rate will always look like a failure — even if it drove thousands of qualified first-time visitors into your funnel. Each campaign should have one primary KPI tied to its funnel stage, with two or three supporting metrics — no more.
The Marketing Metrics That Actually Matter for DTC Brands
Impressions and page views aren't useless. They become useless when they're treated as end goals rather than inputs to downstream revenue. The question every metric should answer is: "Did this move the business?"
Business Impact Metrics Worth Tracking
Customer Acquisition Cost (CAC)
CAC = total marketing spend ÷ new customers acquired. Simple formula, but most brands calculate it wrong by blending all channels into one number that obscures what's actually working.
Calculate CAC per channel. A high CAC is acceptable if your Customer Lifetime Value (CLV) is proportionally high. A low CAC that attracts one-time buyers who never return is far more dangerous.
ROAS and ROMI
These measure different things:
- ROAS (Return on Ad Spend) = revenue ÷ ad spend. Channel-specific and useful for optimizing individual campaigns
- ROMI (Return on Marketing Investment) = broader, including all marketing costs — agency fees, creative production, platform costs
Triple Whale's 2025 data across 33,000+ brands puts the observed 2024 median ecommerce ROAS at 2.04, while describing 3:1 to 4:1 as a generally good range. Your break-even ROAS depends on your margins, fulfillment costs, and purchase frequency — not industry averages.
Conversion Rate
The percentage of visitors or recipients who take a desired action. A 3% rate in paid search and a 3% rate in email signal completely different levels of campaign health. Always track conversion rate by traffic source and campaign type, never as a single blended number.
Customer Lifetime Value (CLV)
Shopify's CLV formula: average order value × purchase frequency × average customer lifespan. For DTC brands with repeat-purchase products, CLV is the metric that determines whether your acquisition spend is actually building a sustainable business.
Improving retention directly increases CLV over time. The levers to pull: repeat purchase rate, email engagement, and SMS engagement.
What Not to Track as Primary KPIs
The most common vanity metrics DTC brands over-index on:
- Impressions — reach without revenue is noise
- Social media likes — engagement that doesn't convert is entertainment
- Email open rates in isolation — especially unreliable since Apple Mail Privacy Protection inflated open tracking
- Website traffic without conversion context — 50,000 sessions and zero purchases is not a success story
Use these as supporting indicators. Never as primary KPIs.
How to Measure Email and SMS Campaign Success Specifically
Email and SMS are two of the most directly measurable channels in a DTC marketer's toolkit. Paid advertising attribution gets contested. Email and SMS don't — platforms like Klaviyo track the full path from send to click to purchase, making it clear exactly what's driving revenue.
FluenceFlow's clients average 41% of total store revenue attributed to email and SMS combined, which means proper measurement of these channels isn't optional — it's where the margin is.
The Key Email and SMS Metrics That Signal Real Performance
Revenue Per Recipient (RPR)
RPR measures how much revenue each send generates per person on the list — accounting for both conversion rate and order value, it gives a cleaner picture of campaign effectiveness than open rate alone.
Klaviyo's 2024 benchmark data puts average campaign RPR at $0.11, while abandoned cart flow RPR reaches $3.65. That gap is exactly why flows and campaigns must be measured separately.
Click-to-Conversion Rate
Distinct from click-through rate. CTR tells you who clicked. Click-to-conversion tells you who clicked and purchased. This is the metric that reveals whether your offer, landing page, and audience targeting are actually aligned — or whether you're generating curious clicks that don't convert.
Unsubscribe Rate and List Health
These are leading indicators of list quality. A rising unsubscribe rate signals poor segmentation, mismatched messaging, or both — and either drags down long-term email revenue. Mailchimp's ecommerce benchmark puts the average campaign unsubscribe rate at 0.19%. Healthy lists have low churn and consistently high engagement across sends.
Flow Performance vs. Campaign Performance
Automated flows (welcome series, abandoned cart, post-purchase) and one-time broadcast campaigns serve different purposes and should be benchmarked differently.
Flows typically drive 30–60% of total email revenue while campaigns handle the remaining 40–70%. Measuring these together hides where revenue is actually coming from. Klaviyo's 2026 ecommerce benchmarks confirm the split matters: flows average a 2.11% placed-order rate versus 0.16% for campaigns.
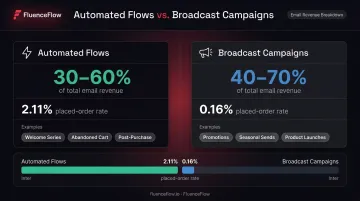
FluenceFlow builds and optimizes both through a unit economics lens — meaning every flow and campaign is measured against the revenue it needs to generate relative to the brand's margins and order values, not generic benchmarks.
SMS-Specific Metrics
SMS is a higher-intent channel and should be measured with proportionally higher conversion expectations:
- Click rate: Klaviyo's 2026 data shows approximately 5% for campaigns and ~10% for flows — well above email benchmarks
- Opt-out rate: Especially important given regulatory sensitivity; self-benchmark against your own list history rather than chasing a universal average
- Revenue per message: Postscript's 2026 data from 17,000+ Shopify stores puts the median at $0.98 per message
Track SMS revenue attributed separately from email. The channel's higher intent warrants its own performance evaluation.
How to Analyze Campaign Data Without Drowning in Numbers
The Baseline Comparison Principle
Raw numbers are meaningless without context. A 2.5% conversion rate could be exceptional or catastrophic depending on your channel, offer, and category.
Always compare results against three reference points:
- Your own historical baseline — same campaign type from a prior period
- A relevant industry benchmark — channel-specific, not blended averages
- The target you set before launch — this is the most important comparison
If you didn't set a target before launch, you're reverse-engineering success — which always produces a winner.
Segmentation Is Where the Real Insights Live
Overall averages hide the most useful information. Break results down by:
- Traffic source
- Audience segment (new vs. returning, high-engagement vs. low-engagement)
- Device type
- Offer type
One segment can carry an entire campaign that looks mediocre in aggregate. That's your signal for where to focus next. Klaviyo's published case studies with Jenni Kayne and Huda Beauty show significant YoY revenue gains after both brands restructured around interest- and engagement-based segmentation — the volume stayed the same; the targeting changed.
The Time Lag Problem
Not all campaigns produce immediate results. Awareness campaigns may take weeks to show purchase impact. Retention flows compound over months. Judging a six-month retention program by its seven-day results is one of the most common ways DTC brands kill campaigns that would have worked.
Set measurement windows that match the campaign type:
- Conversion campaigns: 7–14 day window is reasonable
- Awareness campaigns: 30–60 days before drawing conclusions
- Retention flows: Evaluate over 90 days minimum
The mistake isn't checking results early — it's making irreversible decisions based on an incomplete picture.
Turning Measurement Into Better Campaigns
The Post-Campaign Review Process
Measurement only creates value when it drives action. After every campaign, run a four-step review:
- Identify the primary KPI result — did you hit the target?
- Compare to baseline and target — by how much, in which direction?
- Identify the single biggest contributing factor — positive or negative
- Define one specific change for the next campaign
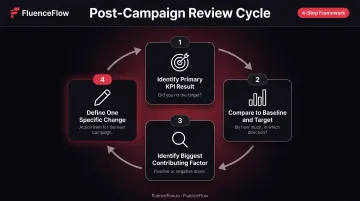
That last step is what most teams skip. Without it, you're running a post-mortem — not building a smarter campaign for next time.
A/B Testing as a Measurement Tool
A/B testing is a measurement methodology, not just a creative exercise. Run one variable at a time — subject line, offer, send time, or audience segment — and use conversion rate or revenue per recipient as the deciding metric. Open rate doesn't tell you enough.
Consistent testing builds compounding advantage. Each test adds a data point that makes the next campaign incrementally more effective. The goal is a "baked-in measurement" mindset: know upfront what success looks like, and hold every campaign accountable to that standard.
When to Reallocate Budget
If a channel consistently underperforms its CAC target across multiple campaigns, that's a signal to shift budget — not run the same campaign one more time with minor changes.
Measurement should inform budget decisions, not just validate creative choices. The 70/20/10 framework (70% of budget to proven channels, 20% to experimental, 10% to new ideas) only works if you're actually tracking which channels are proven — and adjusting when they stop being.
Frequently Asked Questions
How do you analyze a marketing campaign?
Start by comparing results against the goals you set before launch. Segment data by channel and audience to surface patterns that aggregate numbers hide. Draw one or two actionable conclusions — don't try to interpret every metric at once.
What are the 5 marketing metrics?
The five most commonly cited are Conversion Rate, Customer Acquisition Cost (CAC), Return on Ad Spend (ROAS), Customer Lifetime Value (CLV), and Click-Through Rate (CTR). The right five for your brand depend on your campaign goals and which funnel stage you're measuring.
What is the 3-3-3 rule in marketing?
The 3-3-3 rule is an informal heuristic suggesting messages should grab attention in 3 seconds, communicate core value within 3 minutes, and drive a decision within 3 days. It's a useful framing for creative sequencing, though not a research-validated standard.
What is the 70/20/10 rule in marketing?
Originally from Coca-Cola's content innovation model: allocate 70% of budget to proven, reliable channels; 20% to emerging or experimental strategies; 10% to entirely new ideas. Without channel-level ROI tracking, you can't tell which bucket each channel belongs in.
What is a good ROI for a marketing campaign?
A commonly cited baseline is a 5:1 return, but "good" ROI varies significantly by channel, margins, and business model. Triple Whale's observed 2024 ecommerce median ROAS was 2.04 — DTC brands should set their own threshold based on unit economics before launch, not industry averages.
How do you measure email marketing campaign success?
Measure using revenue per recipient, click-to-conversion rate, and list health metrics — not open rate alone. Compare results against your historical baseline and break out by audience segment to identify what's actually driving performance.