Key Takeaways
- Email analytics means measuring and acting on data from both campaigns and automated flows — not just collecting numbers
- Revenue per recipient, CTOR, and flow conversion rates matter more than open rates for DTC brands
- A tiered review cadence — daily, weekly, and monthly — turns raw data into repeatable decisions
- Vanity metric fixation, weak segmentation, and misaligned attribution windows cause most analytics mistakes
- The highest-leverage optimizations usually live inside specific flow steps, not at the aggregate level
Introduction
Most DTC brands send emails. Far fewer understand what their email data is actually telling them.
The gap isn't effort — it's interpretation. Brands check open rates, see a number that feels acceptable, and move on. Meanwhile, their abandoned cart flow converts at half the rate it should, their best segment is buried inside aggregate reporting, and their attribution window is double-counting revenue from customers who would have bought anyway.
That misreading has a real cost. According to Litmus's 2025 research, retail and ecommerce email generates $45 for every $1 spent — but that return belongs to brands that actually act on their data. Most brands are capturing a fraction of it because they're optimizing for the wrong signals.
This guide walks through exactly what to measure, how to interpret it, and how to build a repeatable analytics process that connects email activity to store revenue — not just dashboard numbers.
What Is Email Marketing Analytics?
Email marketing analytics is the practice of measuring, interpreting, and acting on data from your email campaigns and automated flows to make better revenue decisions.
Two terms get confused here constantly:
- Metrics are raw data points — opens, clicks, bounces, unsubscribes
- KPIs are the metrics tied to your specific business goals — revenue per recipient for a DTC brand, conversion rate for a flow, list growth rate for a list-building initiative
Not all metrics are equally useful — and context determines which ones matter. A consumables brand tracking replenishment cycles cares about purchase frequency and repeat open rate. A high-AOV brand selling premium goods cares about revenue per recipient and abandoned cart recovery. The same open rate tells a completely different story depending on what you're selling and how often customers buy.
For retention marketing specifically, email analytics is the feedback loop that tells you whether your list, your content, and your automation strategy are actually driving repeat purchases. Klaviyo's 2025 D2C playbook identifies roughly 30% email-attributed store revenue as the high-performance benchmark — a target, not an industry average. Most brands plateau around 12%. Closing that gap takes analytics-driven optimization — not a higher send volume.
The Core Email Marketing Metrics Every DTC Brand Should Track
Open Rate
Open rate measures the percentage of delivered emails that were opened. It reflects subject line effectiveness and list health — but treat it as a directional signal, not gospel.
Current benchmarks by source:
- Klaviyo (2026): 39.7% average for ecommerce campaigns; 51.9% for flows
- Omnisend (2026): 30.41% for campaigns; varies by flow type (abandoned cart: 37.12%, back-in-stock: 58.80%)
- Mailchimp (2023): 29.81% for ecommerce
The bigger caveat: Apple Mail Privacy Protection, announced in June 2021, pre-fetches tracking pixels and artificially inflates reported open rates. Human opens are now indistinguishable from automated MPP opens in many email platforms. Monitor open rate against your own historical baseline — don't rely on cross-platform averages as benchmarks.
Click-Through Rate vs. Click-to-Open Rate
These two metrics measure different things and are routinely conflated.
| Metric | Formula | What It Measures |
|---|---|---|
| CTR | Clicks ÷ emails delivered | Overall campaign effectiveness (deliverability + content combined) |
| CTOR | Clicks ÷ emails opened | Content and offer quality in isolation |
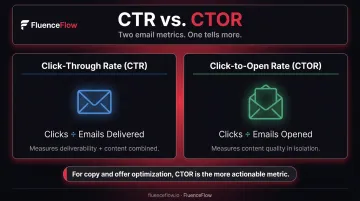
Current ecommerce campaign CTR benchmarks run 0.74% to 1.74% across Klaviyo, Omnisend, and Mailchimp — not the 2%+ figure that circulates in many blog posts. For content optimization, CTOR is the more actionable number because it removes deliverability as a variable.
Revenue Per Email / Revenue Per Recipient
Once you know clicks are happening, the next question is: what revenue do those clicks actually produce? Revenue per email — calculated by dividing total attributed revenue from a send by the number of recipients — translates campaign and flow performance directly into unit economics terms.
FluenceFlow tracks this metric separately for campaigns and flows, then measures it as a percentage of total store revenue. One client grew from 26.76% to 38.48% email revenue share in a single month using this framework. Another reached 48.6% of total store revenue attributed to email.
Deliverability Metrics
Every metric in this guide depends on deliverability first. Poor sender reputation, high bounce rates, or spam complaints can quietly suppress reach before a single campaign goes out — and most DTC brands don't catch the problem until performance is already declining.
Targets to maintain:
- Delivery rate: 97-99% (Omnisend's 2025 data shows 98.4% as an observed ecommerce benchmark)
- Bounce rate: Keep overall bounce rate under 1%; above 2% needs immediate attention per Klaviyo's 2026 guidance
- Spam complaint rate: Below 0.10% per Google's bulk sender requirements; Yahoo's threshold is below 0.3% — these are provider-specific, not interchangeable
- List hygiene: Poor hygiene is the most common deliverability problem in DTC — repeated bounces and spam-trap hits damage sender reputation over time
Unsubscribe Rate and List Health
The target: keep unsubscribe rate below 0.3%. Klaviyo's guidance sets this threshold; observed ecommerce averages from Omnisend and Mailchimp run around 0.19-0.20%.
But the single-number view misses the more important signal: the trend in your active, engaged audience over time. A growing total list with a shrinking engaged segment means your email revenue ceiling is dropping — even if the raw subscriber count looks healthy. Track engagement percentage alongside list size, not instead of it.
How to Measure Email Marketing Performance: A Step-by-Step Process
Measuring email performance isn't a one-time audit — it's an ongoing system. Each step below builds on the last.
Step 1 – Define Goals and Corresponding KPIs
Before pulling a single report, align on what success looks like for each email type:
- Campaign broadcasts: Optimize for CTR and revenue per send
- Automated flows (welcome, abandoned cart, post-purchase): Optimize for conversion rate and revenue per recipient
Mixing benchmarks across these two categories leads to misinterpretation. A 1.5% CTR on a campaign send means something entirely different than a 1.5% placed-order rate on an abandoned cart flow.
Step 2 – Audit Your Deliverability Foundation
Check delivery rate, bounce rate, and spam complaints before evaluating engagement metrics. A 15% open rate on a list with deliverability problems tells a completely different story than 15% on a clean list hitting inboxes consistently.
Build a habit: review your Klaviyo deliverability dashboard before every campaign send. Deliverability metrics should be checked daily — they set the baseline for everything that follows.
Step 3 – Evaluate Engagement by Segment and Email Type
Once you know your deliverability is clean, aggregate numbers still hide the real story. Break metrics down by:
- Audience segment (VIP buyers vs. cold subscribers)
- Email type (flows vs. campaigns)
- Send cadence
A blended 20% open rate across your whole list could mask a 45% rate among repeat buyers and 8% among cold subscribers who haven't opened in six months. Klaviyo's segmentation reporting makes this granular view accessible — and it's worth building that habit into every performance review.
Step 4 – Measure Revenue Attribution Accurately
Attribution windows determine which emails get credit for which sales. Most platforms default to a 5-day click and 5-day open window in Klaviyo.
The risk: high-frequency senders using a 5-day window end up crediting almost every purchase to email — whether email actually influenced the decision or not. Klaviyo's 2024 attribution guidance recommends adapting windows to the customer's actual buying cycle. A longer purchase cycle (furniture, luxury goods) can justify a longer window. A daily email sender needs a tighter window to get an honest read.
Step 5 – Identify Drop-Off Points in Automated Flows
This is where the biggest wins live. In Klaviyo's flow analytics:
- Look at conversion rate and revenue per recipient at each step
- Find the largest drop-off point
- Diagnose whether it's a deliverability issue (low open rate) or a content issue (low CTOR despite decent opens)
High open rate + low CTOR means the email is getting opened, but the offer or copy isn't compelling enough to drive a click. That's a content problem — not a deliverability problem — and each requires a completely different fix.
Step 6 – Act, Test, and Review on a Cadence
| Frequency | What to Review |
|---|---|
| Daily | Deliverability metrics (bounce rate, spam complaints) |
| 48-72 hours post-send | Campaign performance (CTR, revenue, unsubscribe rate) |
| Weekly / bi-weekly | Flow performance by step |
| Monthly | List health trends, attribution accuracy, revenue share evolution |
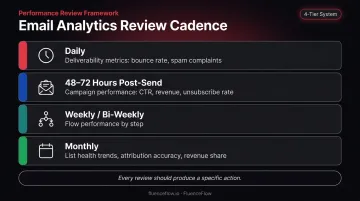
A review is only valuable if it leads to a specific action: a subject line test, a segment suppression, a flow branch update, a new offer variant.
Email Analytics in Action: A DTC E-Commerce Walkthrough
Here's how this plays out in practice.
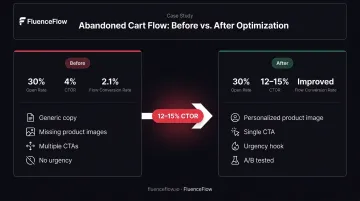
The setup: A mid-AOV DTC apparel brand running Klaviyo with a welcome series, abandoned cart flow, and bi-weekly campaigns. Their overall metrics look fine on the surface — 28% open rate across the account. But their abandoned cart flow conversion rate sits at 2.1%, well below the strong-performer threshold.
The diagnostic: Klaviyo's 2025 benchmark data puts average abandoned cart placed-order rates at 2.68%, with top-10% performers reaching 7.69% in 2024. At 2.1%, this brand is underperforming even the average.
Breaking down step-level analytics reveals the actual problem: Email 2 in the flow (sent 24 hours after abandonment) shows a 30% open rate but only 4% CTOR. The email is being opened. The offer isn't converting.
Common mistakes found at this stage:
- Generic copy that doesn't reference the specific product abandoned
- Missing product images (or low-quality placeholder images)
- Multiple competing CTAs instead of a single clear action
- No urgency — no reason to act now vs. later
The fix: The brand rewrites Email 2 with a personalized product image pulled dynamically, a single CTA, and a time-anchored urgency hook. They A/B test the new version against the original.
After 30 days, CTOR on that email climbs from 4% into the 12–15% range. The overall flow conversion rate improves in step.
What happens next: The improved flow data reveals a segment worth building — high-intent non-buyers who opened multiple emails but never converted. That segment feeds a dedicated re-engagement sequence, which then informs campaign strategy for that audience. That's the real value of step-level data: it tells you not just what broke, but who to target next.
How FluenceFlow Turns Your Email Data Into Revenue
FluenceFlow is a Klaviyo Certified Partner that builds email and SMS systems for DTC brands doing $50K+/month in revenue. The approach goes beyond reading metrics: it's about interpreting what the data means given a specific brand's AOV, purchase frequency, and margin structure, then building flows and campaigns that reflect those economics.
That approach produces a clear outcome: clients average 41% of total store revenue from email and SMS combined. The number is built through the same analytics process described in this guide — tracking attributed revenue separately for campaigns and flows, identifying underperforming steps, and acting on what the data shows rather than what looks good on a dashboard.
What that looks like in practice:
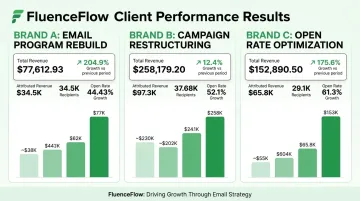
- Deliverability rebuild: one brand went from $0 in email revenue to $97K/month in 44 days after FluenceFlow rebuilt a broken account from scratch
- Open rate and revenue growth: another brand went from 29% to 67% open rates and from $30K to $265K/month — driven by subject line strategy, list segmentation, and sender reputation work
- Campaign restructuring: a third brand scaled email revenue 36x in 30 days (from $364/month to $13,000+/month) through campaign changes alone, without touching flows
After onboarding, brand owners spend roughly 30-45 minutes per week approving campaigns. FluenceFlow handles the analytics monitoring, flow optimization, deliverability tracking, and testing. Weekly performance reports keep brands informed without requiring them to manage the channel themselves.
Every engagement includes a custom contractual performance guarantee: agreed KPIs set before work begins, with a refund provision if targets aren't met.
If your email program is generating data but not clear direction, learn more about FluenceFlow's approach to retention marketing and request a free Klaviyo audit.
Frequently Asked Questions
What are good metrics for email marketing?
For DTC brands, prioritize: open rate (use as directional only, given Apple MPP), CTR (current ecommerce averages run 0.74%-1.74%), delivery rate (97-99%), unsubscribe rate (below 0.3%), and revenue per recipient. The right KPIs depend on whether you're measuring a campaign broadcast or an automated flow — they shouldn't share the same benchmarks.
What is the 80/20 rule in email marketing?
Roughly 80% of email revenue comes from 20% of your list — your most engaged, highest-value subscribers. This is why segmentation and list health matter more than raw size. A smaller, highly engaged list consistently outperforms a large, disengaged one.
What are the 5 T's of email marketing?
The 5 T's framework covers: Tease (subject line), Target (right audience segment), Teach (content that adds value), Test (A/B testing elements), and Track (measuring performance). Analytics power the final two T's — if you're not tracking results, your A/B tests produce nothing you can act on.
What is a good email open rate for e-commerce brands?
Current benchmarks vary significantly by platform: Klaviyo reports 39.7% for ecommerce campaigns, while Mailchimp puts ecommerce at 29.81%. Flows typically run higher — Klaviyo's all-flow average is 51.9%. Because Apple MPP has inflated reported opens since 2021, CTOR and revenue per recipient are more reliable indicators of actual content performance.
How often should I review my email marketing analytics?
Use a tiered cadence: deliverability metrics (bounce rate, spam complaints) daily, campaign performance within 48-72 hours of send, flow performance weekly or bi-weekly, and list health trends monthly. Each review should generate a specific action, not just an observation.
What is the difference between click-through rate and click-to-open rate?
CTR measures clicks as a percentage of total emails delivered — it combines deliverability and content performance in a single number. CTOR measures clicks as a percentage of emails opened, isolating content quality from deliverability. For optimizing copy and offers specifically, CTOR is the metric to move.