Introduction
Most DTC brands can tell you their SMS open rate within seconds. Far fewer can tell you whether their SMS conversion rate is actually good — or just average with a number that sounds impressive.
Here's the problem: depending on the source, a "good" SMS conversion rate could be anywhere from 0.12% to 40%. Both figures appear in industry benchmarks. Both can be correct. They're just measuring completely different things.
That gap isn't a minor footnote. It's why most brands misread their own performance and end up optimizing for the wrong things. This guide explains how to calculate the metric correctly, what benchmarks actually mean for ecommerce, and where the real levers are.
Key Takeaways
- "Good" depends entirely on your denominator — clicks vs. delivered messages produce wildly different rates
- Klaviyo benchmarks classify 1–2% as good and 2.1%+ as great (per delivered message)
- Automated SMS flows generate up to 8x more revenue per recipient than one-time campaign blasts
- List quality and landing page experience drive conversions just as much as the message itself
- Brands running SMS and email together consistently out-convert brands relying on either channel alone
What Is SMS Conversion Rate and How Do You Calculate It?
SMS conversion rate measures the percentage of SMS recipients who completed a desired action — typically a purchase — after receiving your text. The formula is straightforward; choosing the right denominator is where most brands go wrong.
The Formula
(Conversions ÷ Messages Delivered) × 100
A practical example: you send 1,000 texts, 950 are delivered, and 19 result in purchases. Your per-message conversion rate is 2% — which Klaviyo classifies as good.
But if you divide those same 19 purchases by only the recipients who clicked your link (say, 100 clicks), you get 19% — a completely different figure measuring something different entirely.
The three denominators you'll encounter:
- Messages sent — the loosest measure; inflated by undelivered texts
- Messages delivered — the standard for campaign benchmarking (use this)
- Link clicks — click-to-conversion rate; relevant for diagnosing landing page problems
How It Differs From CTR and Open Rate
Once you have your conversion rate, it's worth knowing what it's actually measuring versus the other numbers in your dashboard. Click-through rate tells you how many people tapped your link. Open rate infers how many read the message (though SMS lacks reliable open tracking). Conversion rate is the end outcome — the number that tells you whether your SMS made money.
A high CTR with a low conversion rate usually signals a post-click problem: slow load time, friction in checkout, or a landing page that doesn't match the message's promise.
What's a Good SMS Conversion Rate? Benchmarks by Industry and Campaign Type
Published SMS conversion benchmarks vary widely — and that's not a data quality problem. Different platforms measure conversion differently: some divide by delivered messages, others by clicks. Before benchmarking your numbers against any external source, confirm which denominator they used.
Benchmark Comparison by Source
| Source | Rate | Denominator | Published |
|--------|------|-------------|-----------|
| Klaviyo (good) | 1.0–2.0% | Delivered messages | 2025 |
| Klaviyo (great) | 2.1%+ | Delivered messages | 2025 |
| Postscript (campaigns) | 0.12–0.54% | Unspecified | 2026 |
| Infobip (ecommerce/retail) | 11–20% | Clicks | 2026 |
Sources: Klaviyo campaign benchmarks, Postscript 2026 SMS Benchmarks, Infobip industry data
Cross-Industry Ranges (Click-Based, Infobip)
| Vertical | Conversion Rate |
|---|---|
| Technology | 31–40% |
| Commercial services, education, manufacturing | 21–30% |
| Finance, healthcare | Above 20% |
| Ecommerce, retail, consumer services | 11–20% |
Note: These Infobip figures measure conversions as a percentage of clicks — not delivered messages. Don't mix them with Klaviyo's per-message benchmarks.
Benchmarks by Campaign Type (Postscript, Shopify Brands, 2026)
| Flow Type | CVR Range (25th–75th percentile) | Earnings Per Message |
|---|---|---|
| Campaign blast | 0.12–0.54% | $0.11–$0.55 |
| Welcome series | 0.67–2.67% | $0.58–$3.05 |
| Abandoned cart | 3.97–7.84% | $3.52–$10.95 |
| Browse abandonment | 1.01–2.38% | $0.93–$2.85 |
| Back in stock | 7.18–13.80% | $5.92–$13.34 |
| Winback | 0.20–0.89% | $0.19–$0.82 |
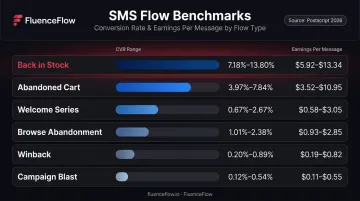
The gap is stark: abandoned cart flows convert at 7–65x the rate of broadcast campaigns, and back-in-stock flows can reach nearly 14%. Automated flows aren't just better — they operate in a different performance category entirely.
SMS vs. Email Conversion Rates
Omnisend's 2025 data — drawn from 20B+ emails across 27,000+ brands — shows campaign email averaging 0.08% and automated email flows averaging 1.49% per delivered message. SMS campaigns and email campaigns land in a comparable range. But both channels follow the same pattern: flows beat broadcasts, and the gap is large.
Setting Your Own Target
Industry benchmarks are a reference point, not a performance goal. A brand with a $20 AOV needs a fundamentally different conversion rate to be profitable than one with a $300 AOV.
Set your target against your own unit economics:
- Margin per order — how much you net after COGS and fulfillment
- Cost per message — what each SMS send actually costs you
- Customer lifetime value — how much a converted subscriber is worth over time
A campaign that looks weak by industry standards might be highly profitable at your margins — or vice versa.
Key Factors That Affect Your SMS Conversion Rate
Timing and Send Frequency
Send time affects whether your message lands when someone is in a buying mindset — or when they're annoyed. Attentive's analysis of 25B+ messages found:
- Highest CTR days: Tuesday and Thursday
- Highest revenue days: Monday and Tuesday
- Best window for clicks: 12 p.m.–3 p.m.
- Best window for revenue and conversion: 4 p.m.–7 p.m.
On frequency, SimpleTexting's 2025 survey found 53% of subscribers cite excessive frequency as their reason for unsubscribing. Klaviyo classifies an unsubscribe rate above 2% as critical. Start conservatively — it's easier to increase frequency than to rebuild a burned list.
List Quality and Subscriber Intent
A segmented list of high-intent subscribers will consistently outperform a larger generic one. Subscribers who opt in through a product-specific popup or a first-order discount convert at measurably higher rates than passive newsletter sign-ups.
The best popup programs pair a compelling incentive (typically 10%+ off) with zero-party data collection — asking subscribers to self-select by purchase intent, occasion, or product preference at opt-in. That segmentation feeds directly into downstream SMS flows, making every subsequent message more relevant.
Message Content and CTA Strength
Standard SMS is limited to 160 characters, so every word has to earn its place. High-performing SMS messages share three traits:
- Clear, specific offer — not "save big," but "20% off your order today"
- Real urgency — a deadline that means something ("Ends midnight tonight" vs. "ending soon")
- Single CTA — one action, one link, no ambiguity
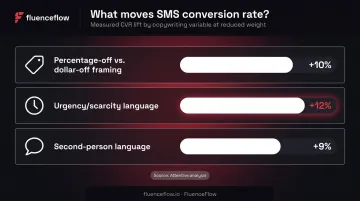
Attentive's analysis of high-performing campaigns found 10% CVR lift from percentage-off vs. dollar-off framing, 12% CVR lift from urgency/scarcity language, and a 9% CVR lift from second-person language in offer campaigns. Test one variable at a time to isolate what's actually moving the needle.
Post-Click Experience
Even a well-crafted message fails if the destination is broken. Post-click friction is one of the most overlooked conversion killers in SMS — and it's entirely within your control. Key areas to audit:
- Mobile page load speed (Google's research found a 0.1-second improvement in mobile speed increased retail conversion by 8.4%)
- Button size optimized for thumbs, not mouse cursors
- Checkout friction — pre-filled fields, minimal form steps, mobile payment options
- Landing page relevance — the page should match the offer in the text exactly
Personalization and Segmentation Depth
Getting the landing page right brings your message full circle — but the most effective SMS programs don't stop there. Behavioral triggers outperform time-based sends because context drives intent. Reaching someone because they abandoned a cart 30 minutes ago is more effective than reaching them because it's Tuesday at 6 p.m. Segments worth prioritizing for DTC ecommerce:
- VIP buyers (top 10–20% by LTV)
- First-time buyers within 30 days
- Lapsed customers (90+ days no purchase)
- Cart or browse abandoners by product category
The more tightly your segment maps to where someone is in the purchase journey, the less work your message copy has to do.
How to Improve Your SMS Conversion Rate
Segment Before You Send
Audience segmentation is the highest-impact lever — before you touch copy, timing, or offer structure. High-value segments for DTC brands:
- VIP buyers — reward with early access or exclusive offers
- First-time buyers within 30 days — focus on second-purchase conversion
- Lapsed 90+ day customers — winback with a reason to return
- Cart abandoners — highest intent, time-sensitive
Build Automated Flows, Not Just Campaigns
Broadcast campaigns are the lowest-converting SMS format. Klaviyo's 2026 data across 183,000+ customers shows SMS flows represent 7.6% of sends but 45.2% of SMS revenue — roughly 8x the revenue per recipient of campaigns.
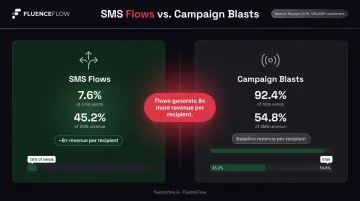
The reason is intent alignment: automated flows arrive when a customer's behavior signals readiness to buy. A campaign blast arrives when your marketing calendar says so.
For Shopify brands building out retention, FluenceFlow typically prioritizes welcome flow setup first, then abandoned cart and post-purchase flows — so every new subscriber enters a nurture sequence from day one.
Write Concise, High-Urgency Messages With One CTA
A framework that works:
- Lead with the offer — put the value in the first line
- State the deadline — specific beats vague every time
- One link, one action — don't give subscribers two things to decide
A/B test one variable at a time: offer framing (% vs. $), urgency language, CTA wording. Emoji use can lift engagement but should be verified with your specific audience before being treated as default.
Integrate SMS With Email for Compounding Results
SMS and email work better together than either does alone. INGLOT Canada recorded a 117% higher cart-abandonment conversion rate and a 2,130% lift in revenue per message when combining email and SMS vs. email alone.
The mechanism is coverage: email captures subscribers who engage with longer-form content; SMS reaches them in real-time when intent is high. Coordinated campaigns — where SMS reinforces an email offer or follows up a non-opener — outperform single-channel sends.
FluenceFlow builds email and SMS systems around a brand's unit economics rather than generic playbooks — which determines how channels are sequenced, not just which ones are used.
Optimize the Mobile Landing Experience
Getting the click is only half the equation. Once someone taps through, the landing experience determines whether they convert. Test:
- Load speed — target under 2 seconds on mobile
- Button sizing — large enough for easy tapping
- Form length — eliminate every unnecessary field
- Page relevance — a dedicated product or offer page almost always outperforms sending traffic to a homepage
Apply the same testing discipline to landing pages that you apply to message copy. A high CTR with low conversion is almost always a post-click problem.
How to Track and Analyze SMS Conversion Rate Performance
Core KPIs to Monitor
| Metric | Good | Great |
|---|---|---|
| Delivery rate | 90–95% | Above 95% |
| Campaign CTR | 8.9–14.5% | 14.6%+ |
| Unsubscribe rate | Below 1.0% | Below 0.5% |
| Revenue per message | $0.41–$0.97 | $0.98–$2.13+ |
| Campaign conversion rate | 1.0–2.0% | 2.1%+ |
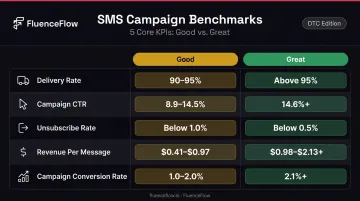
CTR and conversion benchmarks via Klaviyo; revenue per message via Postscript (median $0.98, 25th–75th percentile: $0.41–$2.13).
These metrics interact. High CTR with low conversion points to a landing page problem. Rising unsubscribes with normal CTR suggests frequency or relevance issues.
Setting Up Attribution Correctly
Attribution windows vary by platform:
- Klaviyo defaults: 5-day click, 12-hour delivery attribution
- Postscript defaults: 7-day click, 24-hour view
- Attentive defaults: 5-day click, 1-day view (last-touch)
Use UTM parameters on every SMS link and unique discount codes per campaign to connect sends to purchases. Attribution in multi-touch journeys is never perfectly clean. Tracking flow-level and campaign-level conversion rates separately gives you more actionable data than relying on a blended average.
Benchmarking Cadence
- Days 1–60: Establish your baseline. Don't optimize against a two-week sample.
- Quarterly: Set incremental improvement targets per flow and per campaign type
- Ongoing: Separate seasonal/promotional spikes from structural improvement — a spike during BFCM doesn't mean your baseline improved
Frequently Asked Questions
What is a good SMS conversion rate?
It depends on your denominator. As a percentage of delivered messages, Klaviyo classifies 1–2% as good and 2.1%+ as great. As a percentage of link clicks, Infobip reports 11–20% for ecommerce/retail. The most useful benchmark is the one you track consistently against your own historical baseline.
How do you calculate SMS conversion rate?
Use: (Conversions ÷ Messages Delivered) × 100. Always use delivered messages as your denominator — not messages sent — to exclude undelivered texts and keep your metric accurate.
Why is my SMS conversion rate so low?
The most common causes: sending to an unsegmented list, weak or vague CTAs, sending at the wrong frequency or time, and a landing page or checkout that loses people before they convert. Check load speed and your checkout flow before assuming the message itself is the problem.
What's the difference between SMS click-through rate and SMS conversion rate?
CTR measures how many recipients clicked your link. Conversion rate measures how many completed the desired action — typically a purchase. A high CTR with a low conversion rate typically signals a landing page or checkout friction issue, not a message problem.
How does SMS conversion rate compare to email?
Per delivered message, SMS and email campaigns perform at similar rates — but both channels are outpaced by their own automated flows. The real lift comes from combining them: brands running both email and SMS consistently generate more revenue per recipient than those using either channel alone.
How often should I send SMS messages to protect my conversion rate?
Start with 4–6 promotional messages per month and monitor unsubscribe rates closely. Klaviyo flags anything above 2% as critical. Over-sending is the leading driver of list fatigue and declining conversion — and rebuilding a burned list takes significantly longer than damaging one.