Introduction: Why Most E-commerce Brands Leave Money on the Table
Most e-commerce sites convert at only 1.6% to 2.95%, meaning 97-99% of traffic leaves without purchasing. For brands spending heavily on paid ads and SEO, that is wasted acquisition spend: visitors you've already paid for but never turned into customers.
AI-driven search results are reducing organic click-through rates. Adobe measured a 1,200% increase in AI referrals to US retail sites, but those visitors were initially 43% less likely to convert than traditional traffic. That gap narrowed to 9% by early 2025, yet the trend holds: traffic is getting more expensive and harder to acquire.
The 2026 playbook prioritizes retention-focused systems that maximize value from every visitor across the full customer journey, from first visit through repeat purchases. This article shows you how to run conversion rate optimization across website, email, SMS, and post-purchase touchpoints.
Key Takeaways
- Returning visitors convert at 2.9%, nearly twice the 1.7% rate of new visitors
- Rising acquisition costs make email, SMS, and lifecycle optimization essential for ROI
- Extend CRO beyond your Shopify site to flows, campaigns, popups, and post-purchase
- Match strategy to unit economics: extended nurture for high-AOV, replenishment for consumables
What is Conversion Rate Optimization?
Conversion rate optimization (CRO) is the systematic process of increasing the percentage of website visitors who complete desired actions. The basic formula is simple:
Conversion Rate = (Conversions ÷ Total Visitors) × 100
But "conversion" means different things at different stages:
- Newsletter signup from a popup
- Product page view after landing
- Add-to-cart action
- Completed checkout
- Repeat purchase
CRO splits conversions into two types. Macro conversions are purchases and signups that directly generate revenue or grow your list. Micro conversions, such as product page views, email opens, and cart additions, signal progress toward a sale.
In 2026, CRO spans the full customer experience across channels. Your Shopify site, email flows, SMS messages, and post-purchase touchpoints work together to turn browsers into buyers and buyers into repeat customers.
The 2026 CRO Landscape: Why Retention Matters More Than Ever
AI Overviews in search results are reducing organic click-through rates, making traffic acquisition more expensive and difficult. When searchers get answers directly in Google's AI summaries, fewer click through to your site. This shift makes it critical to maximize the value of every visitor you do attract.
Retention-focused businesses earn higher lifetime value. Returning visitors convert at 2.9%, while new visitors convert at only 1.7% (a 71% lift). Returning visitors already make up 52.8% of traffic, so that gap compounds into real revenue.
The best DTC brands in 2026 generate 35-45% of revenue from email and SMS to existing customers. Those results depend on retention systems built around unit economics, not generic templates:
- A consumable at $45 AOV with a 30-day repurchase cycle needs replenishment timing and frequency-led offers
- A $400 premium product with an 8-month decision cycle needs nurture sequences and education-led flows
FluenceFlow builds those systems around each brand's AOV, purchase frequency, margins, and buying cycle. Optimizing for repeat purchases often beats first-purchase CRO alone because you've already paid the acquisition cost. CRO strategy has to connect to customer lifetime value, not just the initial conversion.
How to Calculate and Benchmark Your Conversion Rate
Conversion rate is simple: (orders ÷ visitors) × 100. If your Shopify store received 10,000 visitors last month and generated 200 orders, your rate is:
(200 ÷ 10,000) × 100 = 2.0%
"Average" rates matter less than tracking your own improvement over time. Industry benchmarks still vary widely by category:
- Food & beverage: 6.22%
- Beauty & personal care: 4.94%
- Fashion & apparel: 3.06%
- Home & furniture: 1.41%
- Luxury & jewelry: 0.94%
Those category averages only set context. Calculate rates by segment to see where real opportunity sits:
- New vs. returning visitors
- Traffic sources (organic, paid, email, social)
- Device types (mobile vs. desktop)
- Product categories
Then measure conversion at each funnel stage so you can pinpoint drop-off:
- Landing page → Product page
- Product page → Add to cart
- Add to cart → Checkout initiated
- Checkout → Purchase completed
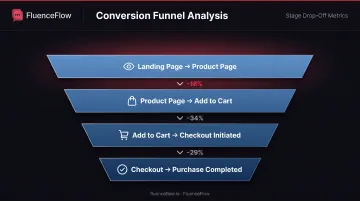
Stage-level rates show where friction lives and which fixes will move revenue first.
Essential CRO Strategies for E-commerce Brands
These six levers move the needle for DTC and Shopify brands: product pages, cart recovery, mobile UX, social proof, personalization, and CTAs.
Optimize Product Pages for Different Buyer Stages
Structure product pages to serve both research-phase browsers and ready-to-buy visitors:
- Information hierarchy: Place key details (price, size options, add-to-cart button) above the fold for ready buyers
- High-quality images: Show products from multiple angles with zoom capability; include lifestyle shots and detail views
- Detailed descriptions: Answer common questions about materials, dimensions, care instructions, and usage
- Size guides and fit information: Reduce purchase anxiety by helping customers choose correctly the first time
- Customer reviews: 95% of users rely on reviews when learning about products
Add trust signals prominently:
- Security badges near checkout buttons
- Clear return and exchange policies
- Shipping costs and delivery timeframes
- Contact information for customer support
Reduce Cart Abandonment with Strategic Interventions
Cart abandonment averages 70.22% across e-commerce. The top abandonment causes are:
- Unexpected costs (40%)
- Slow delivery (20%)
- Card security concerns (19%)
- Required account creation (18%)
Address these with strategic interventions:
- Exit-intent popups: Trigger when users show abandonment signals, offering help or limited-time incentives
- Simplified checkout: Offer guest checkout, minimize form fields, show progress indicators
- Cart abandonment email sequences: Klaviyo benchmarks show 50.50% open rates, 6.25% click rates, and $3.65 revenue per recipient (top performers hit $28.89)
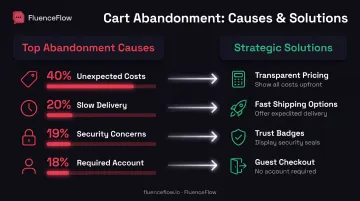
FluenceFlow builds custom cart-recovery sequences tailored to each brand's margins and buying cycle, with timing and messaging adjusted by business model rather than generic templates.
Create Friction-Free Mobile Experiences
Mobile accounts for 69.9% of e-commerce traffic, yet desktop conversion is 74% higher. Close this gap:
- Ensure mobile site loads in under 3 seconds
- Make all buttons and links easily tappable (minimum 44×44 pixels)
- Optimize checkout with autofill capabilities
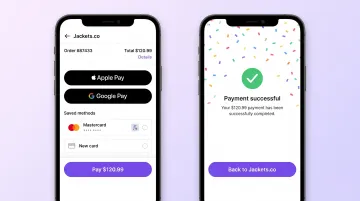
- Add mobile payment options: Apple Pay, Google Pay, Shop Pay
- Test thumb-friendly navigation and place key actions within easy reach
- Simplify forms: ask only for essential information
Leverage Social Proof Throughout the Funnel
Display social proof at key decision points:
- Product and collection pages: Show star ratings, review counts, and recent customer testimonials
- Urgency notifications: Add "recently purchased" or "X customers viewing this now" messages to create FOMO
- Homepage and landing pages: Feature customer testimonials and user-generated content
- Checkout pages: Reinforce trust with review highlights and "join X satisfied customers" messaging
Implement Personalization Based on Behavior
Personalization can lift conversion 10-15% and satisfaction about 20%:
- Show product recommendations based on browsing history and past purchases
- Tailor homepage content for customer segments: new visitors, active customers, lapsed buyers
- Use dynamic content in emails that reflects individual preferences and purchase patterns
- Adjust messaging by lifecycle stage. First-time visitors need education; repeat customers respond to loyalty rewards
Optimize Your Calls-to-Action
Test and refine CTAs for maximum impact:
- Use benefit-driven copy: "Get My 15% Discount" outperforms generic "Submit"
- Test button design: Try different colors, sizes, and styles so primary CTAs stand out from secondary actions
- Strategic placement: Position CTAs above the fold, after key product information, and at natural decision points throughout the page
The Role of Email and SMS in Conversion Optimization
Email and SMS move prospects and customers through your funnel at every stage. Built as lifecycle systems, they become primary conversion drivers for DTC brands, not passive newsletters.
Essential Automated Flows
Build these core lifecycle flows to drive conversions:
- Welcome series: Engage new subscribers right away with brand intro, bestsellers, and a first-purchase incentive
- Browse abandonment: Re-engage visitors who viewed products but left while interest is still fresh
- Cart abandonment: Recover shoppers who added items but didn’t check out (critical for high-AOV brands, where abandonment can hit 80%)
- Post-purchase: Turn first-time buyers into repeat customers with follow-up, education, and cross-sells
- Win-back: Re-engage lapsed buyers before competitors take them
According to Klaviyo benchmarks covering 167,000+ e-commerce brands, automated flows generate nearly 41% of email revenue from just 5.3% of sends. Flow click rates hit 5.58%, versus 1.69% for campaigns: more than 3× the engagement.
That performance only holds when flows match how your customers actually buy.
Unit Economics-Based Flow Strategy
Tailor your approach to your business model:
High AOV / Low Frequency (premium products $400+): Buyers often need 8–15 touchpoints before they purchase. Use longer nurture sequences with education, proof, and trust-building, then post-purchase cross-sells. Skip heavy discounting that undercuts positioning.
Low AOV / High Frequency (consumables, CPG): Push hard for the first order, then time replenishment reminders to real usage windows, not only label guidance. Add progressive rewards that raise switching costs, and trigger win-back before competitors do.
Mid AOV / Mid Frequency (large catalogs, seasonal products): Segment on purchase and browse behavior. Steer people toward bestsellers and high-margin items, and focus on turning first-time buyers into repeat customers.
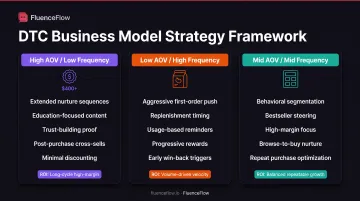
FluenceFlow builds these retention systems around each brand’s unit economics instead of generic templates, helping clients drive 35–45% of total revenue from email and SMS.
Common CRO Mistakes to Avoid
Even strong CRO programs stall when teams fall into a few predictable traps:
- Skipping tests for "best practices": What works for other brands may not fit your audience, price point, or model. Always test assumptions.
- Optimizing only for first purchase: Ignoring post-purchase experience leaves lifetime value on the table. Returning visitors convert 71% better than new ones.
- Running weak tests: A/B tests need 95% confidence, 1,000+ visitors per variation, and 2-4 weeks to reach significance. Don't stop early because the first results look good.
- Ignoring customer quality: A 20% conversion lift means little if AOV drops 30% or new buyers never return. Measure the full impact.
- Neglecting mobile: Mobile drives 50-70% of e-commerce traffic, yet desktop conversion runs about 74% higher. Closing that gap is often your biggest win.
- Relying only on quantitative data: Analytics show what customers do; qualitative research shows why. Use session recordings, user tests, and interviews to find friction.
Frequently Asked Questions
What is a conversion optimization strategy?
A systematic, data-driven approach to increasing the percentage of visitors who complete desired actions. It covers research to find friction, hypothesis-led testing, and rolling winning changes across your site and marketing channels.
What are CRO strategies?
Specific tactics used to improve conversion rates, including UX improvements, A/B testing, personalization, email and SMS optimization, and customer journey refinement. Effective strategies combine website optimization with lifecycle marketing across channels.
How do I increase my website’s conversion rate?
Analyze performance and drop-off points, form hypotheses about friction, run structured A/B tests, ship winning variations, and keep iterating as behavior and data change.
What is a good website sales conversion rate?
"Good" is relative to your industry, traffic sources, and business model. Typical e-commerce ranges from 1-3%, with top performers reaching 3-5% or higher. Focus on improvement over time rather than arbitrary benchmarks. A 0.5% lift from 2% to 2.5% is 25% revenue growth.
What are some common mistakes made in conversion rate optimization?
Common mistakes include shipping untested changes, ignoring mobile traffic, optimizing pages in isolation instead of the full journey, and stopping after early wins instead of building continuous improvement.
What are best practices for optimizing your conversion path?
Map the full journey from first touch to repeat purchase and cut friction at each stage with simpler forms, clearer CTAs, and fewer steps. Build trust with social proof, personalize by behavior, and support the path with email and SMS flows that nurture and retain customers.
Ready to maximize conversion rates across your entire customer journey? FluenceFlow builds custom email and SMS retention systems around your brand’s unit economics rather than generic templates. We turn traffic you’ve already paid for into repeat revenue.
Clients see an average 10.6× ROI in the first 90 days and average 41% of revenue from email and SMS. Every engagement includes a custom performance guarantee, month-to-month flexibility, and full ownership of flows and designs in your Klaviyo account.